
1313 Bloor St W
Development feasibility
307 Saint Helen’s Avenue, Toronto, Ontario M6H 4A2 · A 35-storey mixed-use high-rise, underwritten end to end inside SiteYield.
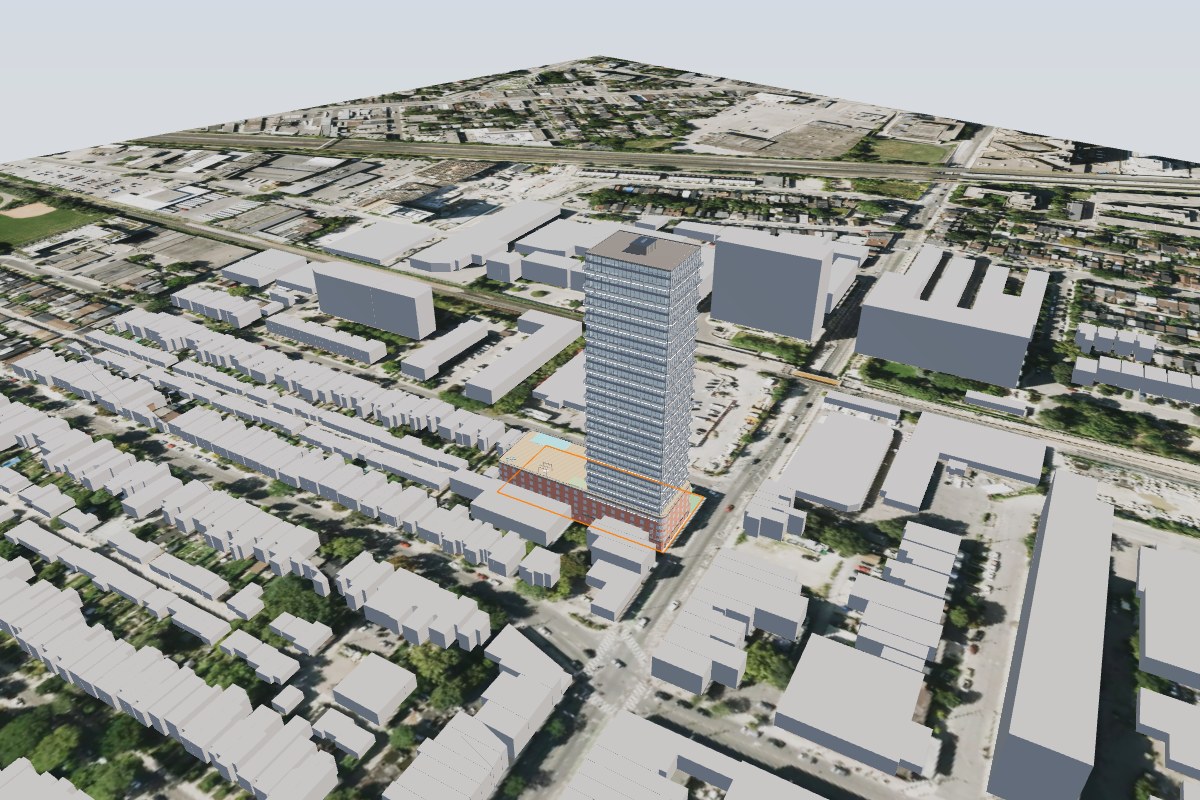 ● LIVE 3D massing · 108.2 m
Executive summary
A 35-storey high-rise of 315 residential units and 20,715 sf of ground-floor commercial space on a 30,757 sf site — the highest-and-best-use scenario modelled for 1313 Bloor St W.
Total project cost is estimated at $304.69M against gross revenue of $377.29M, producing a profit margin of 23.8% and an internal rate of return of 14.7%. The report that follows provides site analysis, the zoning framework, building massing, unit mix, a full pro forma, a cost summary, a discounted-cash-flow model with Monte Carlo risk analysis, and project recommendations — with sources and assumptions cited throughout.
3D massing views
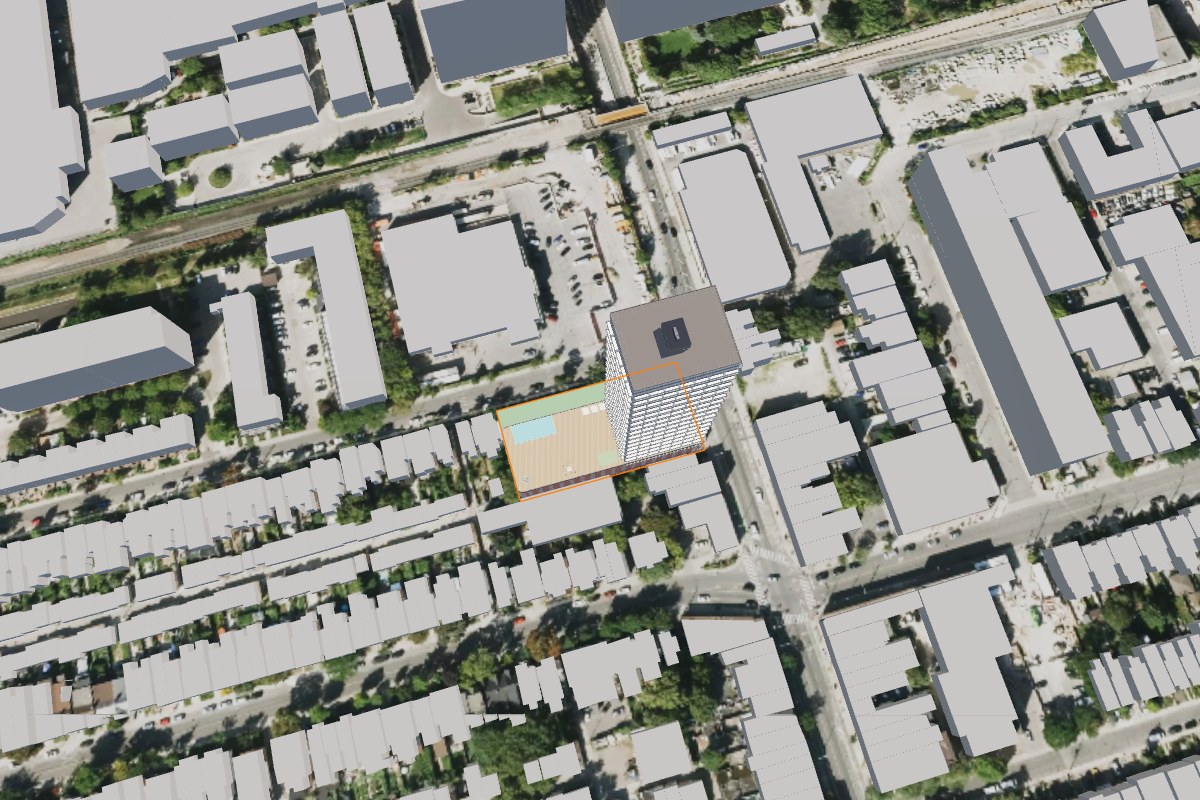
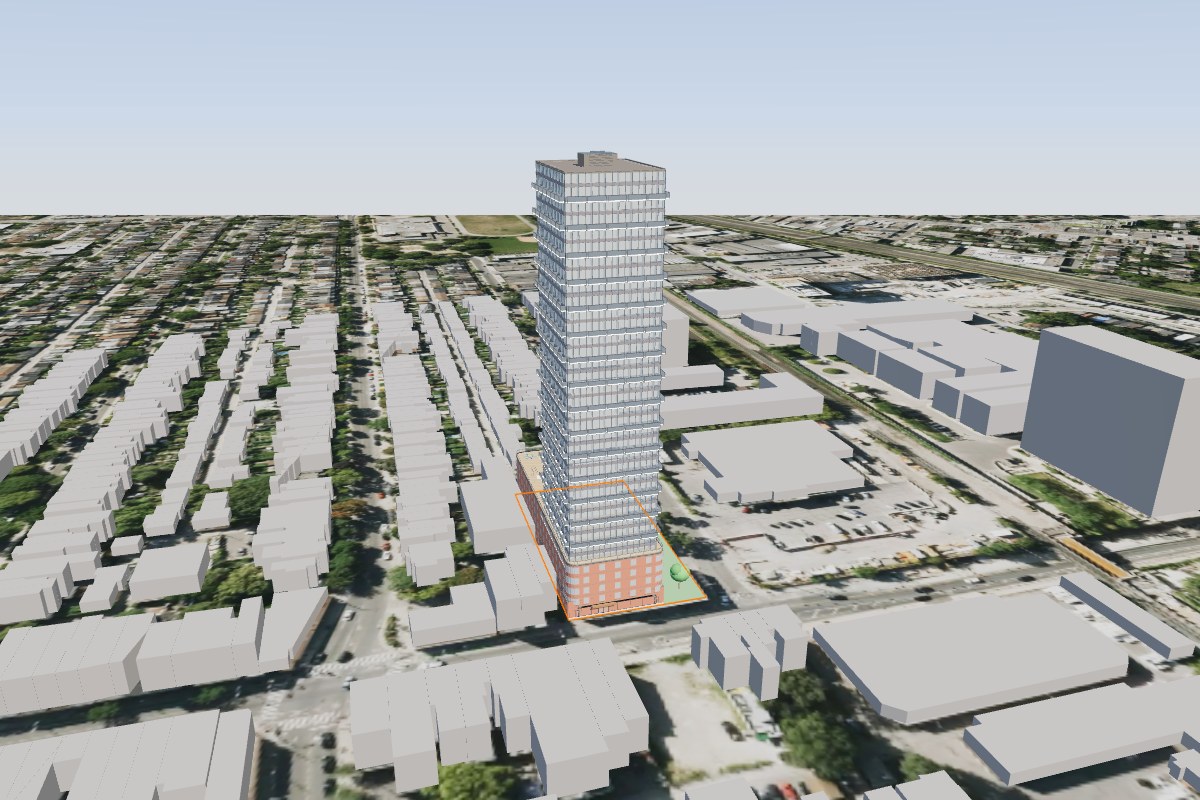
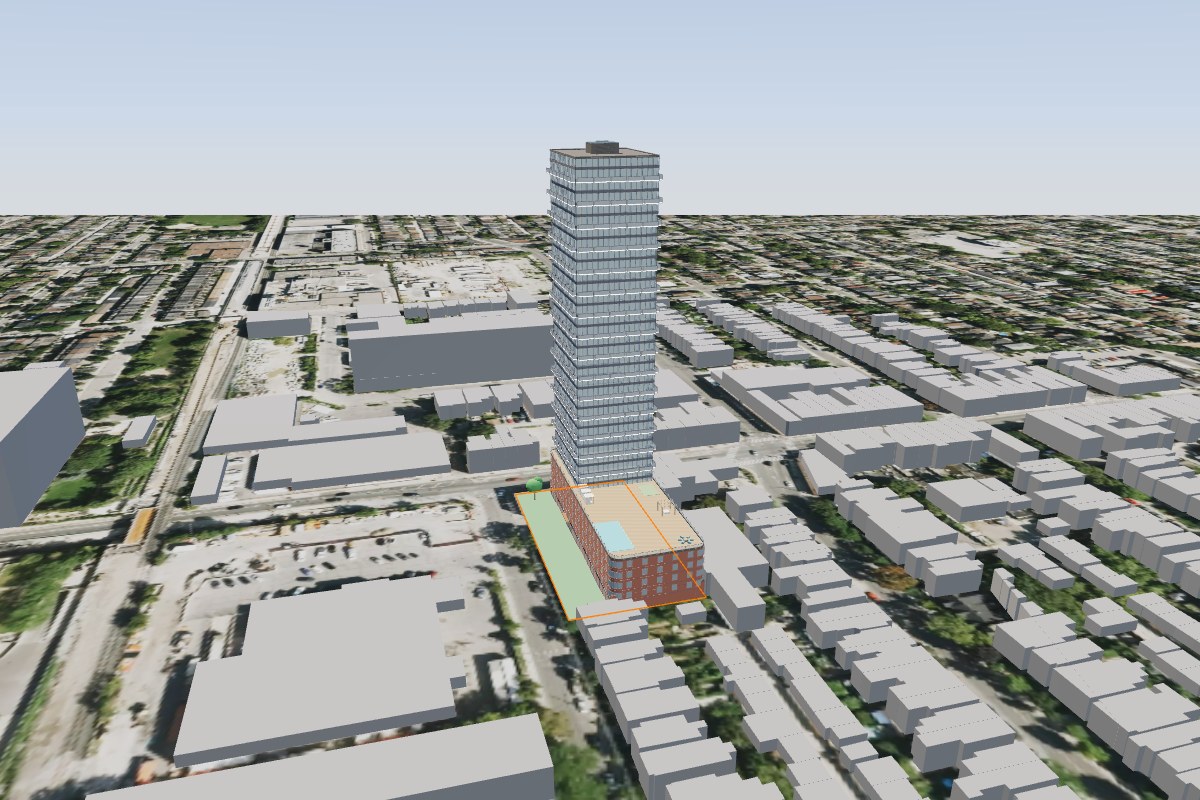
The proposed massing rendered in situ against the surrounding built form — a 108.2 m tower on a mixed-use podium, generated directly from the zoning-backed volume model.
Site analysis
307 Saint Helen’s Avenue, Toronto, ON M6H 4A2 · 43.65774, −79.44350. A ~30,757 sf (2,857 m²) parcel within the City of Toronto, off the Bloor West / Dundas West corridor.
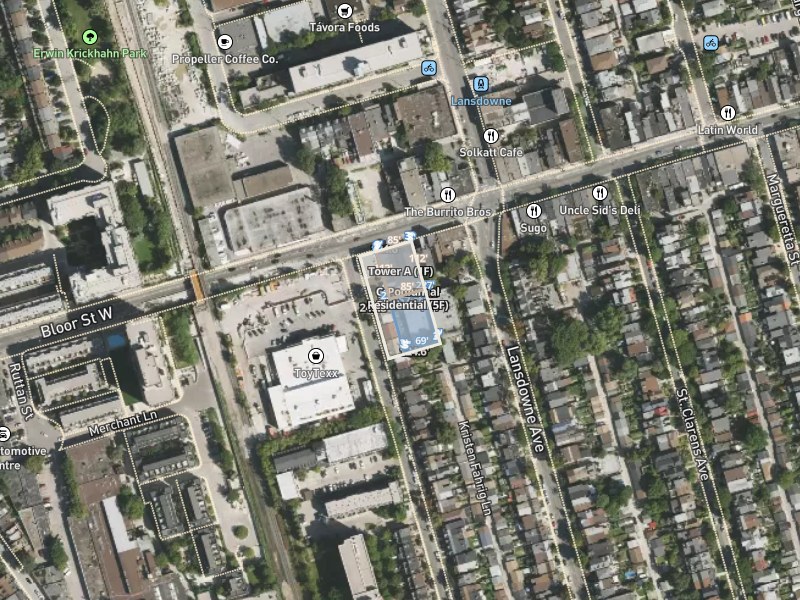 ◉ Subject site
1.2 Lot dimensions & configuration
| Dimension | Imperial | Metric |
|---|---|---|
| North frontage | 187′ | 57.0 m |
| West side — upper depth | 190′ | 57.9 m |
| West side — lower depth | 82′ | 25.0 m |
| East side — step (N–S) | 136′ | 41.5 m |
| East side — step width | 0′ | 0.0 m |
| South frontage | 187′ | 57.0 m |
| Total lot area | 30,757 sf | 2,857 m² |
The lot configuration supports a podium-and-tower massing strategy: the primary frontage accommodates a mid-rise podium while the secondary frontage supports a taller tower element. Multiple street frontages enable separation of residential access from commercial servicing. Surrounding context, transit proximity, and infrastructure capacity should be confirmed through a site visit and review of the City of Toronto Official Plan, zoning by-law, and any area-specific policies.
Zoning & planning framework
The site is zoned Commercial Residential (CR) under City of Toronto Zoning By-law 569-2013. Every compliance check below is cited to its by-law or design-guideline source.
2.1 Zoning designation
The CR zone permits a broad range of uses — apartment buildings, retail stores, restaurants, personal-service shops, offices, day nurseries, community centres, and places of worship. Key as-of-right parameters (verify against site-specific provisions): residential and mixed-use with ground-floor commercial; minimum setbacks of front 3.0 m, rear 7.5 m, side 5.5 m residential / 0 m commercial; a 45° angular plane from rear lot lines abutting residential zones; amenity space of 4.0 m²/unit indoor + 4.0 m²/unit outdoor; and Category 1 parking rates (0.7–1.0 spaces/unit residential, 0.1/unit visitor).
2.2 AI zoning compliance analysis
307 Saint Helen’s Avenue is zoned CR 3.0 with a height limit of 11 storeys and an FSI cap of 3.0× (1.0 commercial, 2.0 residential). The proposal (10.95× FSI, 35 storeys as modelled) is 3.65× the as-of-right density and 24 storeys above the height cap. The site is not in an MTSA/PMTSA and does not benefit from transit-oriented density uplift, so a site-specific ZBLA is mandatory. Recommendation: reduce to an 8–11 storey as-of-right envelope, or pursue a ZBLA targeting 18–25 storeys (5.0–6.5× FSI) with robust planning justification, shadow/wind studies, and Section 37 negotiation.
2.2.1 As-of-right permitted envelope
2.2.2 Compliance issues
2.2.3 Recommended compliance pathways
Supporting massing adjustments to reach a compliant envelope: reduce the podium from 6 to 4 storeys (80% ROW rule); add a 10 ft tower stepback from the podium face; set the front setback to 10 ft, rear to 10 ft podium / 41 ft tower, side-E to 12 ft / 41 ft, side-W to 4 ft / 41 ft; maintain the commercial ground floor for street-level activation; and define explicit tower width and depth within the buildable envelope.
2.2.4 Opportunities identified
- ZBLA pathway. Dundas West is a major commercial corridor with recent intensification. Build a justification around housing supply (180–200 units), ground-floor retail activation, a Section 37 contribution, and corridor-character compatibility. Target 18–22 storeys (5.0–5.5× FSI).
- Section 37 negotiation. For a realistic 180–200 unit ZBLA, negotiate ~$500k–750k in community benefits — affordable housing, Dundas West streetscape improvements, community space, and public art.
- Shadow / wind mitigation. Conduct equinox shadow and wind studies; reduce tower height, narrow the footprint, or increase setbacks where exceedances appear.
- Parking negotiation. The walkable, transit-adjacent location supports reduced ratios (0.5/unit, car-share, generous bike parking) with potential off-site agreements.
- Affordable housing. Negotiate a Section 37 contribution of 20–30% below-market units or cash-in-lieu, sized to the final unit count.
2.4 Angular plane & shadow analysis
The massing establishes a 1–5–1–4F streetwall along the primary frontage with ground-floor commercial at 15 ft floor-to-floor. The tower element (35F) is set back from the podium edge to reduce visual bulk and shadow on adjacent low-rise properties. The tower floor plate of 701 m² sits within the 750 m² maximum for point towers (Tall Building Design Guidelines §3.3), preserving slender proportions and sunlight access — no floor-plate relief required. At 108.2 m (35 storeys), shadows fall primarily to the north and northwest during morning hours at the equinoxes; the summer-solstice shadow clears the southern residential properties by roughly 11:30 am.
2.5 Comparable precedents
Of 304 development applications identified in the vicinity, the 12 most relevant — prioritising built and under-construction projects, proximity, and comparable scale — are shown below.
| Address | Developer | Storeys | Units | Status |
|---|---|---|---|---|
| 278 Sterling Rd / 1423–1437 Bloor St W | OZ | 18 | 197 | Council Approved |
| 6 Howard Park Ave | OZ | 11 | 130 | OMB Approved |
| 1728 Bloor St W | OZ | 19 | 99 | OMB Approved |
| 288, 300 Geary Ave | CD | 4 | — | Draft Plan Approved |
| 1930–1938 Bloor St W / 3, 5 Quebec Ave | OZ | 19 | 144 | OMB Approved |
| 290 Old Weston Rd | OZ | 29 | 321 | OMB Approved |
| 406, 410 Keele St | CD | 5 | 65 | Draft Plan Approved |
| 1613 St Clair Ave W | OZ | 17 | 258 | Council Approved |
| 360, 370 Dufferin St | OZ | 29 | 768 | Council Approved |
| 157 Hallam St | CD | — | 4 | Draft Plan Approved |
| 299 Glenlake Ave | OZ | 11 | — | Council Approved |
| 798 Dovercourt Rd | CD | — | — | Draft Plan Approved |
The 304 active applications signal significant intensification pressure. The tallest proposal is 26 Ernest Ave at 79 storeys; the largest by unit count is 213 Emerson Ave / 1245 Dupont St / 1260 Dufferin St at 3,547 units, indicating the market can absorb substantial residential inventory in this area.
Building massing
A mixed-use podium and point tower totalling 336,641 sf of GFA at 108.2 m — 315,926 sf residential over 20,715 sf of ground-floor commercial.
3.1 Volume breakdown
| Volume | Storeys | Floor plate | Total GFA | GF comm. |
|---|---|---|---|---|
| Commercial podium | 1F | 20,576 sf | 20,576 sf | Yes |
| Podium residential | 5F | 20,516 sf | 102,580 sf | — |
| Tower A | 1F | 9,519 sf | 9,519 sf | Yes |
| Tower A — S1 | 35F | 7,544 sf | 264,040 sf | — |
| Tower A | 4F | 8,596 sf | 34,384 sf | Yes |
| Total | 336,641 sf |
3.2 Design parameters
Unit mix & program
315 suites averaging 712 sf, weighted toward studio and one-bedroom units for young professionals and transit commuters, with larger units for downsizers and small families.
4.1 Residential unit schedule
| Unit type | Avg size | Count | Mix % | Total NSA |
|---|---|---|---|---|
| Studio | 400 sf | 27 | 8.6% | 10,800 sf |
| 1-Bedroom | 520 sf | 97 | 30.8% | 50,440 sf |
| 1-Bed + Den | 600 sf | 54 | 17.1% | 32,400 sf |
| 2-Bedroom | 750 sf | 68 | 21.6% | 51,000 sf |
| 2-Bed + Den | 850 sf | 26 | 8.3% | 22,100 sf |
| 3-Bedroom | 1,000 sf | 25 | 7.9% | 25,000 sf |
| Penthouse | 1,800 sf | 18 | 5.7% | 32,400 sf |
| Total | — | 315 | 100% | 224,140 sf |
4.2 Ground-floor commercial
| Tenant category | Area | Rent ($/sf NNN) | NOI | Cap rate | Value |
|---|---|---|---|---|---|
| Lobby retail | 9,282 sf | $40 | $352,733 | 5.5% | $6.41M |
| Restaurant / F&B | 5,569 sf | $35 | $185,185 | 5.5% | $3.37M |
| Service commercial | 3,713 sf | $30 | $105,820 | 6.0% | $1.76M |
The ground-floor program assumes a grocery-anchored retail mix reflecting neighbourhood demand for walkable daily-needs retail along the corridor, with net leasable commercial area of 18,565 sf after lobby, loading, and mechanical deductions.
Development pro forma
Driven directly from the massing model: $377.29M gross revenue against $304.69M total cost, a $72.60M developer margin, and a 14.7% unlevered IRR.
5.1 Revenue
| Source | Amount | $/sf GFA |
|---|---|---|
| Residential sales (315 units) | $354.69M | $1,054 |
| Commercial value (cap rate) | $11.54M | $34 |
| Parking (158 @ $60,000) | $9.48M | — |
| Lockers (158 @ $10,000) | $1.58M | — |
| Total gross revenue | $377.29M | $1,121 |
5.2 Development costs
| Category | Amount | $/sf | % total |
|---|---|---|---|
| Land acquisition | $21.63M | $64 | 7.1% |
| Hard construction | $134.32M | $399 | 44.1% |
| Soft costs (incl. DCs) | $77.05M | $229 | 25.3% |
| Financing & time | $64.59M | $192 | 21.2% |
| Total development cost | $304.69M | $905 | 100% |
5.3 Returns summary
5.3b Sensitivity — margin on cost
Rows: revenue $/sf (base $1,106). Columns: hard cost $/sf (base $380). All other assumptions held at base.
| Rev \ Cost | $342 | $361 | $380 | $399 | $418 |
|---|---|---|---|---|---|
| $995 | 35.7% | 31.6% | 27.8% | 24.1% | 20.7% |
| $1,051 | 35.7% | 31.6% | 27.8% | 24.1% | 20.7% |
| $1,106 | 35.7% | 31.6% | 27.8% | 24.1% | 20.7% |
| $1,161 | 35.7% | 31.6% | 27.8% | 24.1% | 20.7% |
| $1,217 | 35.7% | 31.6% | 27.8% | 24.1% | 20.7% |
AI pro-forma optimization
An automated stress of the inputs against 2024–26 Toronto market data — surfacing where the model’s cost, financing, and mix assumptions diverge from benchmark and what each change does to margin.
The project is fundamentally misaligned with the CR zone: the submitted 35 storeys at 10.95× FSI is a 3.65× density overage requiring major rezoning (likely OPA + rezoning to Mixed-Use High-Rise or Downtown Core). While the headline margin appears strong in absolute terms, it masks critical planning risk — the project is not approvable as-of-right and faces substantial uncertainty in ZBLA timelines, conditions, and cost escalation. The unit mix, hard costs, and DC rates are internally consistent, but the zoning overage is the showstopper.
5.4.1 Market benchmarks
| Metric | Project | Market range |
|---|---|---|
| Cost per sf | $858 | $900–$1,200 |
| Revenue per sf | $1,114 | $1,100–$1,600 |
| Margin % | 23.1% | 15–22% |
5.4.2 Actionable suggestions
- Revise hard cost to $420/sf (from $331) — $331/sf suits a 5–8 storey building; 2024 Toronto data indicates $400–475/sf for a 35-storey tower. Impact: −$30.2M margin.
- Increase soft cost to 26% of hard (from 23.5%) — rezoning adds planning, legal, environmental, and traffic studies. Impact: −$10.6M margin.
- Increase Section 37 / CBC to $12k/unit (from $5k) — a 35-storey CR-zone rezoning triggers substantial community-benefit negotiation. Impact: −$2.2M margin.
- Increase parking to 0.5 stalls/unit if the City requires — 150 stalls vs 90. Impact: −$3.6M margin.
- Extend construction to 78 months to absorb rezoning delay (24–36 mo typical). Impact: −$5–8M margin.
- Rebalance the mix — cut 3-BR (highest DC rate) and lift 1-BR toward the ~40% Toronto market weight. Impact: +$0.3–0.5M margin.
- Raise pre-sales deposit to 25% and reduce LTC to 60% — improves cash flow and lowers financing risk during rezoning. Impact: +$5–8M margin combined.
5.4.4 Cost flags
- Hard construction $331/sf — critical underestimate. Market $400–475/sf for a 35-storey tower; revising to $420/sf implies ~−$30.2M margin.
- Soft costs 23.5% of hard — moderate underestimate. A 35-storey tower with rezoning typically runs 24–28%; ~−$10.6M at 26%.
- Development charges $60k/unit — confirm indexing. Blended rate for this mix ~$50k/unit; indexed to 2027 ~$52–54k; if not indexed, −$3–6M.
- Section 37 $5k/unit — critical underestimate. High-density CR rezoning typically $8–15k/unit; recommend $12k = $3.6M.
- Parking 90 stalls (0.30/unit) — moderate underestimate. Midtown standard 0.5–0.8/unit; 150 stalls at 0.5 = +$3.6M cost.
- Parkland dedication $3.5M — conservative. Formula suggests ~$0.7–1.9M; current estimate is defensible, no adjustment needed.
AI risk assessment
Scenario spread, break-even headroom, and stress testing across the key drivers — with a Monte Carlo distribution behind the key outputs.
A financially viable mixed-use development, conditional on the rezoning pathway in §2. At the modelled $331/sf hard cost, the project returns a 23.8% margin on cost and 14.7% IRR, with the Monte Carlo downside cases remaining profitable. Commercial NOI ($986K) and parking ($6.1M) provide stable ancillary revenue. Primary risks are hard-cost escalation at tower scale (§13 tests $420/sf), interest-rate sensitivity, and the rezoning timeline. Proceed with active cost controls and rate-lock hedging — subject to the planning resolution above.
5.5.1 Scenario analysis
5.5.2 Break-even thresholds
| Input | Current | Break-even | Headroom |
|---|---|---|---|
| Hard cost escalation | $331/sf ($111.3M) | $385/sf (~$129.5M) | $54/sf · 16.3% |
| Residential absorption | 29 months | 42–45 months | 13–16 months |
| Commercial cap rate | 5.5–6.0% ($12.99M) | 7.0%+ ($10.2M) | 100–150 bps |
| Interest rate (blended) | ~5.75% ($56.6M) | 7.5%+ ($72M+) | 175 bps |
| Regulatory timeline delay | 36 months | +12–15 months | ~12 months |
5.5.3 Stress tests
5.5.4 Mitigation strategies
- Hard-cost lock-in & escalation caps — secure a fixed-price GMP with major trades by building permit; 8–10% contingency reserve; cuts the 11.3% tornado swing on hard costs.
- Interest-rate hedging / rate lock — forward rate-lock or swap on 60–70% of financing; ~$8–16M margin protection if rates spike.
- Pre-sales & deposit capture — launch at building permit with a 20% deposit structure; targets 60–70% pre-sales, shortening financing duration and lifting IRR to ~20%.
- Commercial lease commitments (LOIs) — anchor-tenant LOIs by site plan approval de-risk the $13.0M commercial value and lock the cap rate.
- Regulatory-timeline acceleration — early City engagement and a complete submission compress the OPA/ZBLA + site-plan window, saving 3–5 months of carry.
- Value engineering, contingency management & financing optimization — 2–3% hard-cost reduction, a ring-fenced 8–10% reserve, and a blended construction/permanent structure improve the equity multiple toward ~2.25–2.35×.
- Market monitoring & pivot triggers — a quarterly KPI dashboard with defined triggers (cost, absorption, rates) enables early course-correction before margin compresses.
AI comparable insights
Where the project sits against the submarket — pricing, absorption, and the differentiation levers available in Toronto’s Bloor West Village area.
Positioned as a mid-market mixed-use high-rise in Toronto’s Bloor West Village area. At $1,073/sf average, the project prices 2–8% below downtown/midtown benchmarks ($1,100–1,600/sf) but aligns with suburban positioning. The mix skews to 1–2 bedroom units (68% of portfolio) for young-professional / small-family demand; penthouse pricing at $1,575/sf achieves an appropriate +47% premium. Incomplete volumetric data and limited comp specificity keep confidence moderate.
5.6.1 Pricing assessment
Defensible at 4.2% below the comp median, reflecting an appropriate discount for the Bloor West Village location while holding margin targets. Modest upside ($1,100–1,150/sf) is possible if pre-sales exceed 40% in the first 90 days.
5.6.2 Absorption analysis
A ~180 unit/year pace (15–18 month sell-out for comparable 250–350 unit projects) suggests a ~20-month absorption window — manageable but not aggressive. A phased launch is recommended to manage absorption risk.
5.6.3 Differentiation opportunities
- Lifestyle positioning vs downtown density — the village character supports +$50–75/sf if marketing emphasizes neighbourhood over generic downtown high-rise.
- Expand the commercial podium — growing retail from ~1 floor to 2–3 (12,000–18,000 sf) could lift project NOI 8–12% and activate the street.
- Parking / locker pricing & bundling — unbundled parking at $70–85k/stall plus premium lockers could add $8–12k/unit of value.
- Penthouse & signature-suite tier — lifting premium units toward the 10–15% market weight and adding a 1,200–1,400 sf signature tier could add $2–3M of value.
Cost summary
The full cost stack, plus the City of Toronto application and permit fees for an OPA + ZBLA rezoning at this scale (2026 fee schedule).
6.1 Hard & soft costs
| Category | Amount |
|---|---|
| Hard costs ($380/sf × 336,641 sf) | $127.92M |
| Hard-cost contingency (5.0%) | $6.40M |
| Soft costs (26.0% of hard) | $77.05M |
| Financing | $64.59M |
| Total project cost | $304.69M |
6.2 Pre-development & approvals
| Application | Fee |
|---|---|
| Official Plan Amendment — base | $232,603 |
| OPA + ZBLA — per m² GFA | $194,843 |
| Section 37/45 community benefit (legal) | $76,251 |
| Site Plan Approval — base | $43,605 |
| SPA — per m² residential GFA | $157,612 |
| SPA — per m² non-residential GFA | $10,334 |
| Engineering / servicing review | $8,000 |
| Building permit | $936,603 |
| Total pre-development fees | $1,659,852 |
DCF model & risk analysis
A 95-month discounted cash flow with a 3,000-run Monte Carlo simulation — the range of outcomes, not a single point.
7.1 Cash-flow summary (95-month project)
7.2 Monte Carlo risk analysis (3,000 simulations)
| P10 (bear) | P25 | Median | Mean | P75 | P90 (bull) | |
|---|---|---|---|---|---|---|
| IRR | 12.8% | 14.1% | 15.6% | 15.6% | 17.0% | 18.3% |
| Margin | 19.5% | — | 29.5% | 29.7% | — | 40.2% |
7.3 Key risk drivers (tornado)
Construction timeline
Total duration of 71 months (5.9 years) from pre-application through occupancy — phases auto-computed from the building geometry using Toronto Planning median application durations and CMHC construction-rate benchmarks.
Recommendations & conclusions
8.1 Development recommendation
Based on the analysis, SiteYield recommends proceeding with a Zoning By-law Amendment (ZBA) and Site Plan Approval (SPA) application for the proposed mixed-use development. The project yields a profit margin of 23.8%, exceeding the industry-standard 15% viability threshold, and the Monte Carlo simulation confirms a 97.8% probability of achieving the target return across a range of market conditions.
8.2 Key risk factors
8.3 Next steps
- Engage a planning consultant for pre-application consultation with the City of Toronto.
- Commission a Phase 1 Environmental Site Assessment (ESA).
- Prepare and submit the ZBA and SPA applications.
- Engage a structural engineer for shoring design and below-grade parking layout.
- Initiate the pre-sales marketing program (target 70% pre-sale threshold for construction financing).
- Secure a construction-financing commitment (target 60% LTC at prime + 200 bps).
- Tender the construction contract with a fixed-price GMP structure.
Assumptions & sources
Every key input carries its source, as-of date, and confidence — high = sourced or confirmed; medium = standard assumption; low = unconfirmed default. Verify before committee.
| Input | Value | Source | Confidence |
|---|---|---|---|
| Construction cost | |||
| Hard cost ($/sf GFA) | $380 | Altus 2026 Canadian Cost Guide · GTA | High |
| Soft costs (% of hard) | 28% | Industry-standard cost stack | Medium |
| Hard-cost contingency | 15% | Institutional cost-stack standard | Medium |
| Revenue — for-sale | |||
| Residential $/sf | $1,176 (1BR) | Submarket tiers · AI comps 2024–26 | Medium |
| Comparable projects | 304 nearby | City of Toronto Open Data (CKAN) · live | Medium |
| Land & statutory | |||
| Land price | $20,000,000 | User input | Medium |
| Land transfer tax | ON + Toronto | Ontario LTT + Toronto Municipal LTT brackets | High |
| Development charges | Standard schedule | City of Toronto DC by-law schedule | High |
| Zoning & planning | |||
| FSI / height / coverage | CR | City zoning layer (ArcGIS) · live | High |
| Compliance checks | Cited per rule | By-law 569-2013 · Tall/Mid-Rise Guidelines · Planning Act | High |
Generate a report like this for your site.
Pick a parcel and SiteYield returns zoning-backed massing, a live pro forma, comparable approvals, and a lender-facing report — in an afternoon, not two weeks.